Reading your Activity dashboard
The Activity dashboard is where you see Costello at work. It answers one simple question: is my receptionist earning its keep, and where can I improve? Open Activity in the left-hand menu to find it.
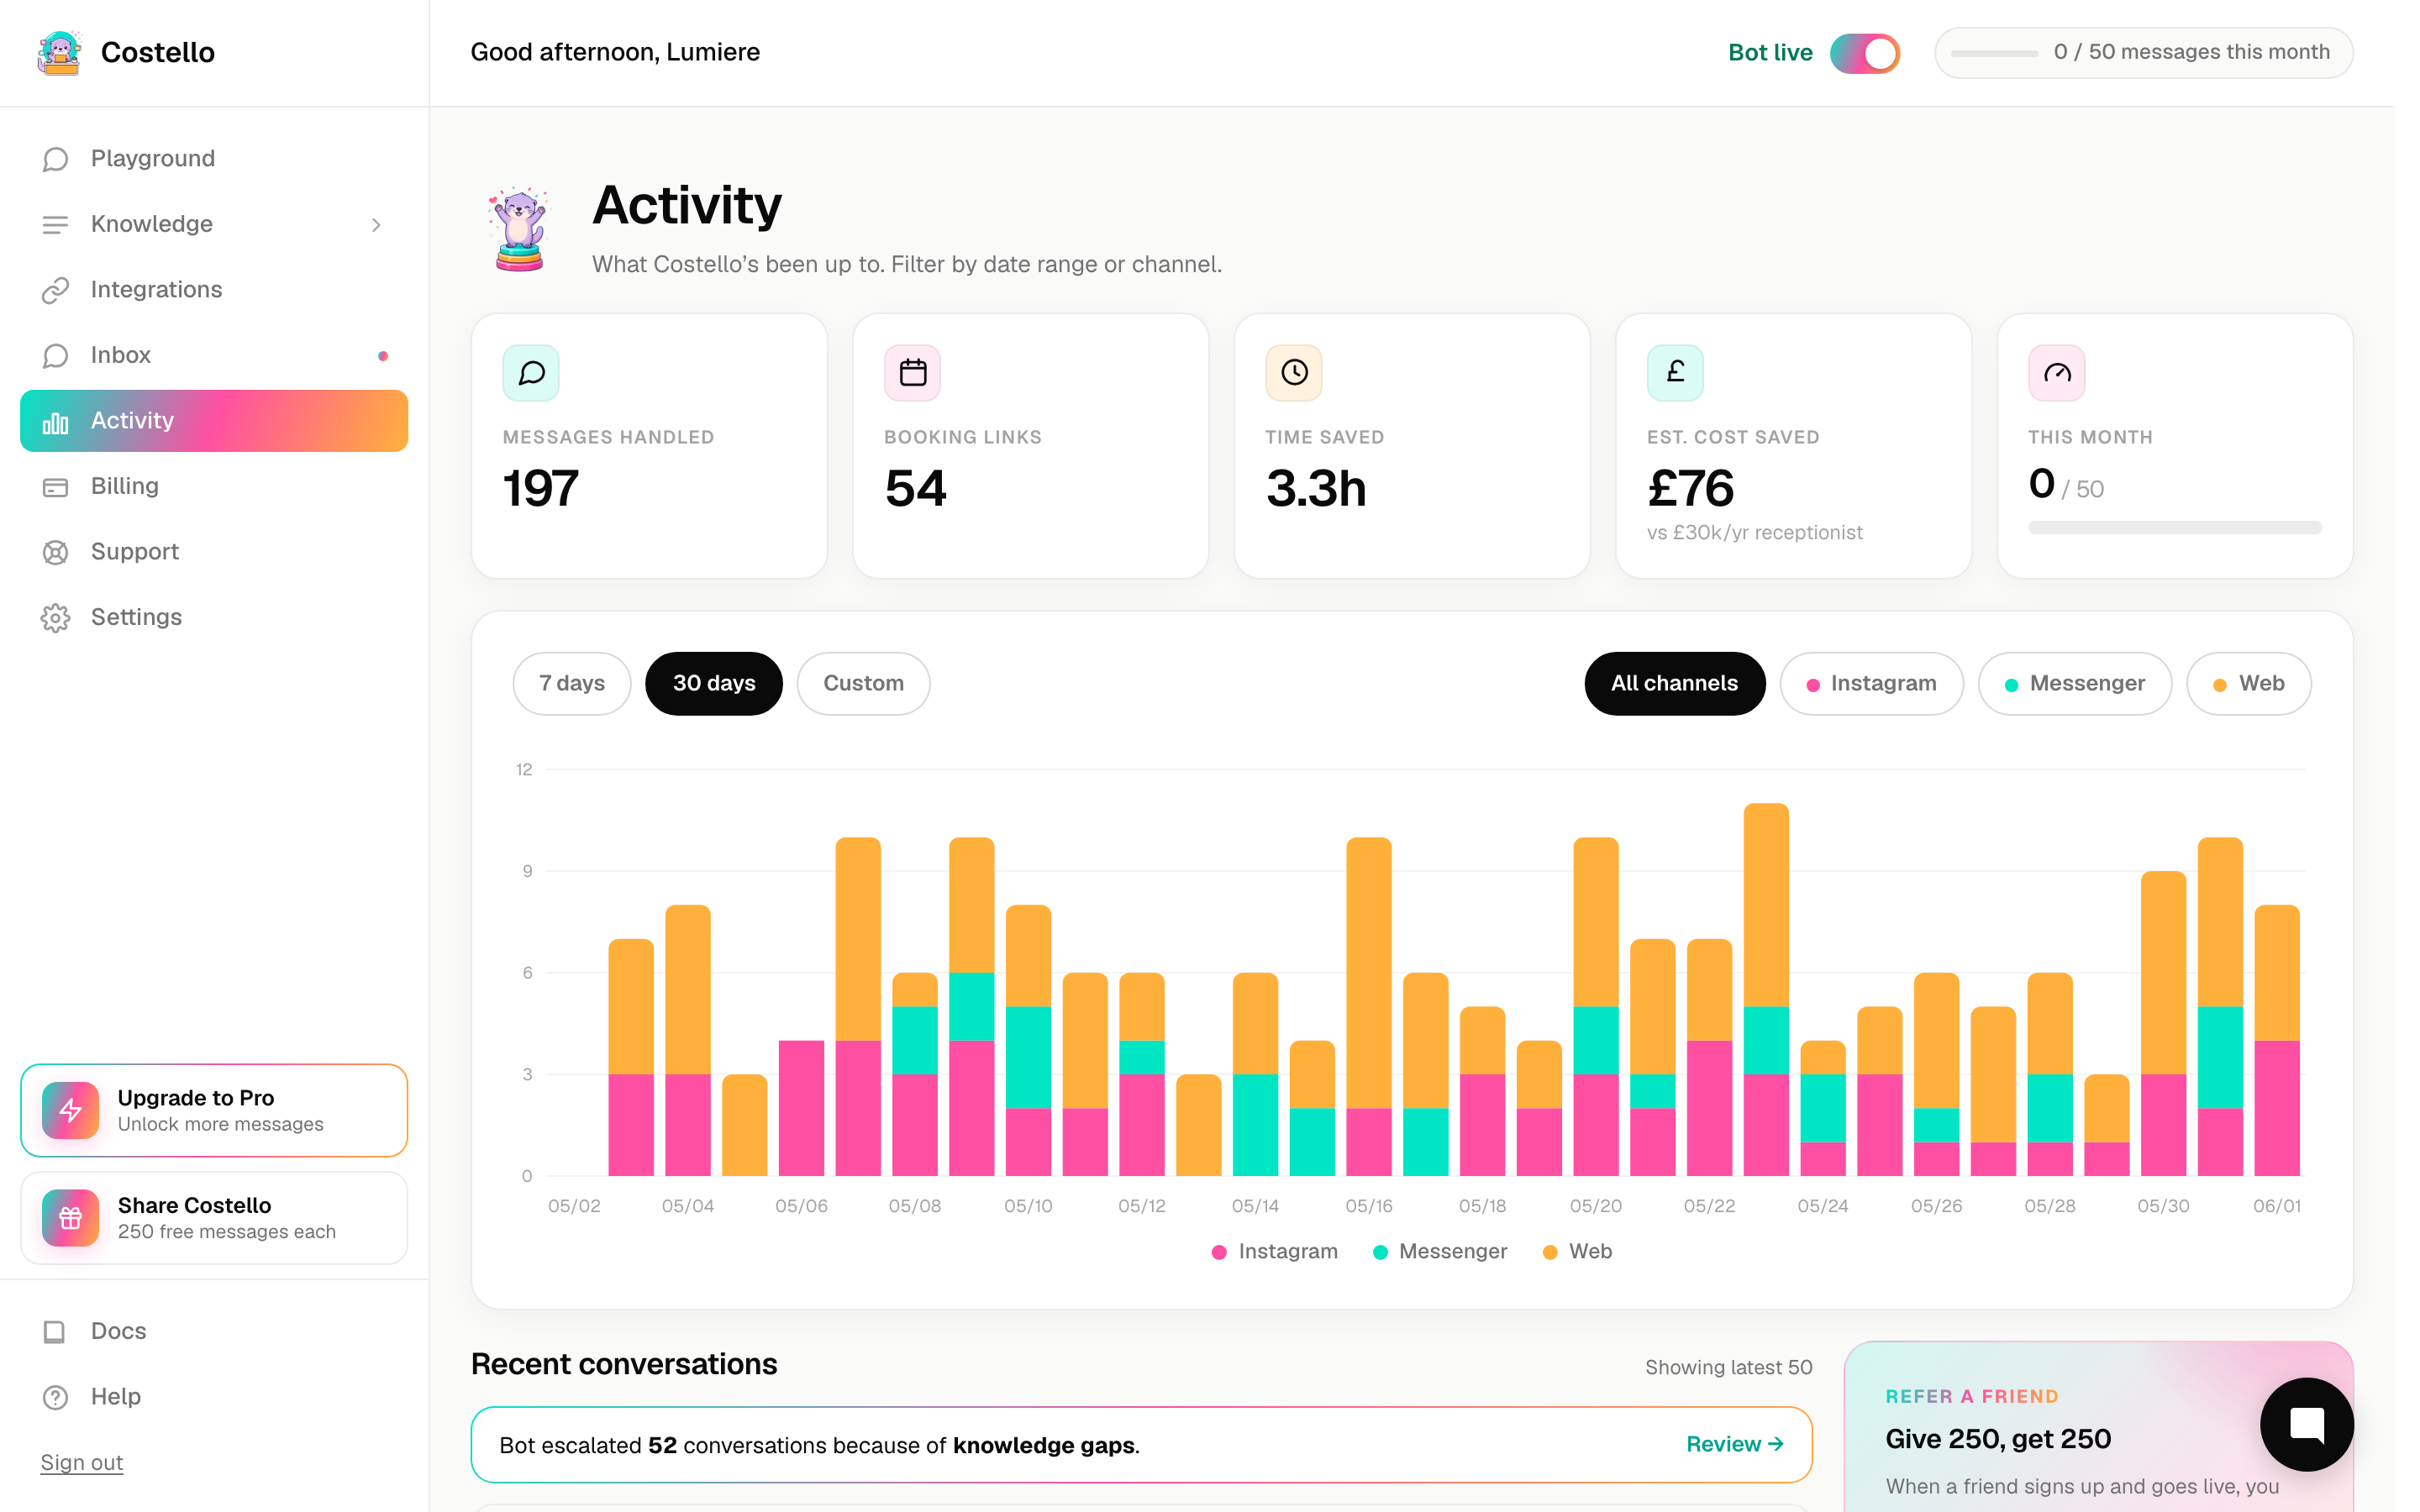
Everything from every channel — Instagram, Messenger, and your website chat — appears here together, so you get one honest picture of how your enquiries are being handled.
Choosing what you see
Two controls at the top of the page let you focus the numbers:
- Date range — switch between the last 7 days, the last 30 days, or a custom range. Use 7 days for a quick "how's this week going" check, and 30 days to spot trends.
- Channel filter — show All channels together, or narrow to just Instagram, Messenger, or Web chat. Handy when you want to know which channel is bringing in the most enquiries.
Every metric and chart on the page updates to match what you've selected.
The headline metrics
These five numbers tell you, at a glance, what Costello has done for you.
Here's what each one means, and what to do about it.
| Metric | What it tells you | How to act on it |
|---|---|---|
| Messages handled | The volume of work Costello took off your plate. | A healthy, rising number means more of your enquiries are being answered without you lifting a finger. |
| Booking links sent | How often an enquiry turned into a real booking opportunity. | This is your closest measure of revenue. If messages are high but links sent is low, your knowledge may not be steering people towards booking. |
| Hours saved | The time Costello gave back to you. | A reminder of the hours you're no longer spending glued to your DMs. |
| Money saved | Those hours, valued in pounds. | The simplest way to see your return — compare it against what you pay for Costello. |
| Knowledge-gap escalations | The times Costello had to flag "I don't know this one". | The most useful number for improving. Each one is a question worth adding an answer for. |
The ratio between booking links sent and messages handled is the best signal of whether Costello is converting interest into bookings. If lots of people are messaging but few are getting your booking link, it's worth reviewing what Costello says when someone shows interest.
The volume chart
Below the headline numbers is a bar chart showing how many messages came in each day, stacked by channel. Each bar is one day; the colours within it show how much came from Instagram, Messenger, and web chat.
Use it to spot your busy days and quiet spells, and to see which channel is pulling its weight. If one channel is suddenly silent, that can be an early sign something needs connecting again.
Turning numbers into action
The dashboard is most useful when you check it with a goal in mind:
- High escalations? Each one is a gap in what Costello knows. Tighten your answers and the number falls over time.
- Low booking links? Costello may not be confidently pointing people to your booking page. Review your business information and key answers.
- A quiet channel? Check it's still connected and your widget is live.